Basic CGM Statistics - Introduction
analysis
When Karen meets with her endocrinologist, they look at a Medtronic report titled “Sensor & Meter Overview”. Using Nightscout Continuous Glucose Monitor (CGM) data to produce a clinically equivalent report will be my first big step in using this data. Today’s post is a baby step in that direction.
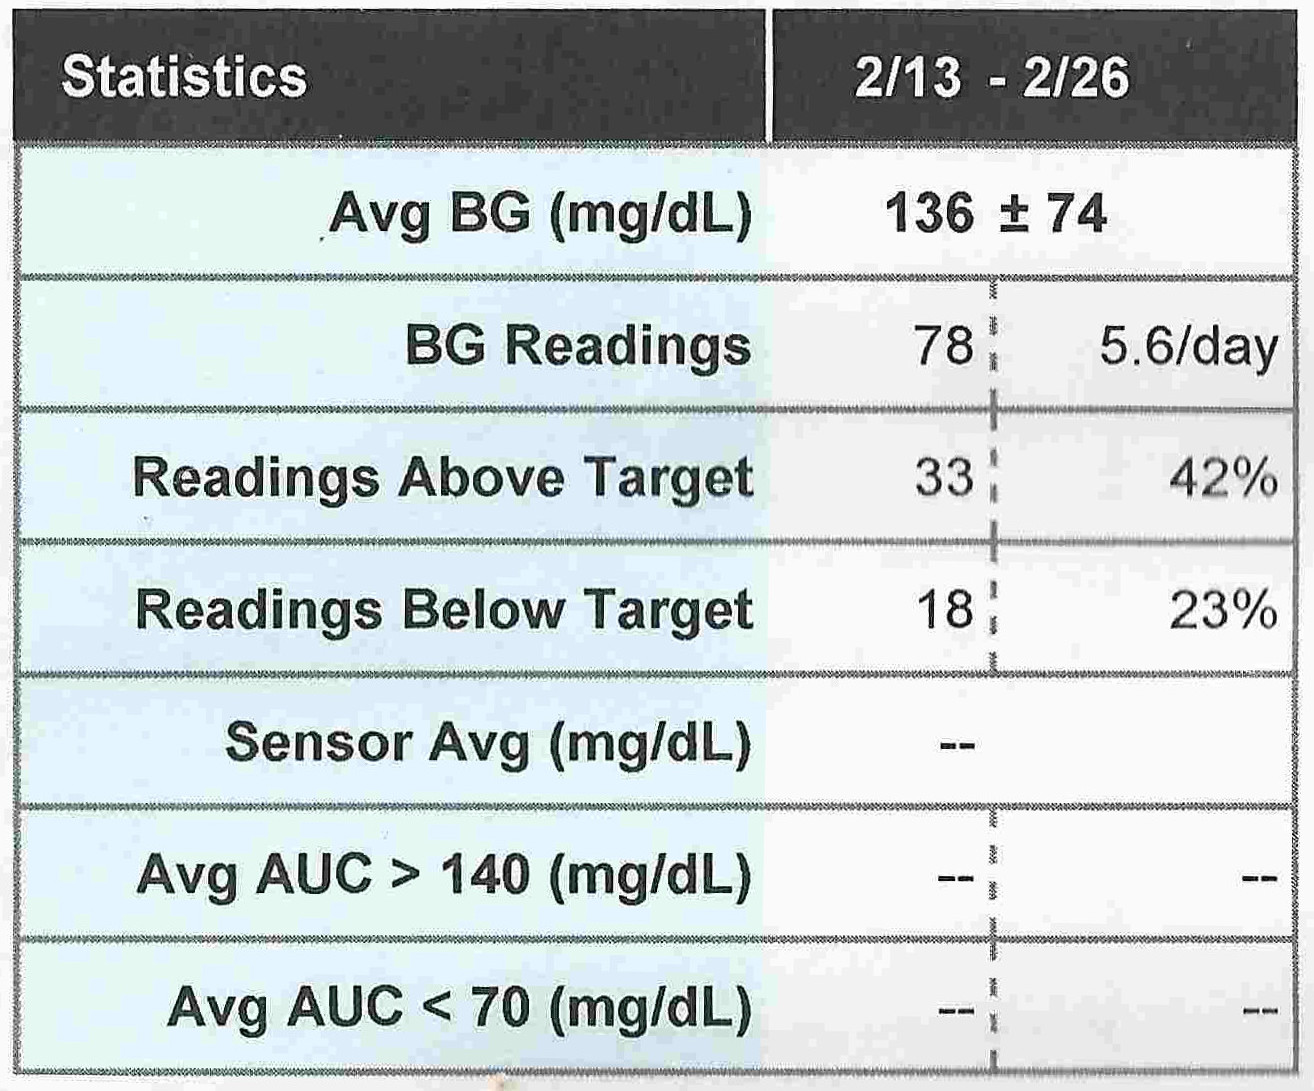
The report I am using as my canonical example is a five page report which contains a “Statistics” table on page two. An example of this table is provided below (Figure 1). This table contains a set of descriptive statistics from manual blood glucose tests and CGM readings. Today, we will discuss some of the measures found in the Statistics table.
In the past month or so, I have written and rewritten a discussion of the measures in the Statistics table AND R demo code to replicate them. Those who know me will not be surprised when I say the post became unwieldy and long-winded. I got bogged down in the writing. It was over 15 pages. What may surprise some of you is this; I shortened it! You can call me Hemingway.
The “Statistics” table from the Medtronic report contains 12 rows of descriptive statistics. The table shown below is an example scan showing data from February 13 - 26, 2015. The picture, as shown, only shows the first seven rows of the table because the others are not relevant to a discussion about blood glucose data.
Over the next week or so, I will publish at least two posts which will include demo R and will use Nightscout CGM data to produce tables which are clinically similar to the descriptive statistics in this table.
Table 1 describes the measures in the Statistics table that are relevant for this week’s discussion. The first four rows of the Statistics table are based on manual blood glucose tests, not CGM data. Only measures based on CGM data can be directly replicated using Nightscout data.
It is possible to use Nightscout data to estimate the other measures. But, the resulting measures must be discussed and considered carefully because of the differences in measurement and accuracy. The differences between manual blood tests and CGM readings will be discussed in greater detail later this week.
| Data Element | Statistics Table | Data Source | Replicated | Data Element Description |
|---|---|---|---|---|
| 1 | Avg BG (mg/dL) | Manual Blood Glucose Test | No | Average blood glucose levels and standard deviation |
| 2 | BG Readings | Manual Blood Glucose Test | No | Number of manual tests during measurement period and the average number of manual tests per a day |
| 3 | Readings Above Target | Manual Blood Glucose Test | Yes | Number and proportion of CGM readings above 140 mg/dL |
| 4 | Readings Below Target | Manual Blood Glucose Test | Yes | Number and proportion of CGM readings below 70 mg/dL |
| 5 | Sensor Avg (mg/dL) | Continuous Glucose Monitor Reading | Yes | Average CGM reading during the measurement period |
| 6 | Avg AUC > 140 (mg/dL) | Continuous Glucose Monitor Reading | No | Average Area Under Curve (AUC) for readings over 140 mg/dL |
| 7 | Avg AUC < 70 (mg/dL) | Continuous Glucose Monitor Reading | No | Average Area Under Curve (AUC) for readings under 70 mg/dL |
The goal of diabetes management is to use insulin, diet, activity and monitoring to artificially maintain blood glucose homeostasis. The desired outcome of these efforts is a blood glucose level between 70 and 140 mg/dL. We will define readings below 70 mg/dL as hypoglycemia or “lows” which must be treated by consuming sugar to raise the blood glucose level. Readings above 140 mg/dL are defined as hyperglycemia or “highs” which must be treated by injecting insulin. Hyperglycemia damages the body and leads to complications including diabetic neuropathies. We want to prevent as many of these as possible.
How much damage is a function of both the severity and the duration of hyperglycemia. Brief but extreme spikes in blood-sugar can actually be less damaging to Karen’s body that extended periods of moderately high blood glucose levels. This is why the Medtronic report includes the Average Area Under The Curve (AUC) which accounts for both the severity and duration of hyperglycemia. Unfortunately, there are competing methods for calculating the Average AUC. As a result of this complexity, Average AUC will be discussed at a later date (probably not this week).
This week’s posts will focus on producing a clinically similar version of the measures derived from mannual tests and the last three measures derived from CGM sensor data (rows 3-5).
You may have noticed that many of the measures in the Statistics table are blank. All measures based on CGM data are blank because the Medtronic system cannot get data from Karen’s Dexcom Continuous Glucose Monitor. Humanity was able to land on the moon with a computer that today would not qualify as a child’s calculator. But device interoperability often eludes us.
Although the missing numbers are regrettable, the Statistics table is useful because it shows us measures doctors find useful when reviewing a patient’s recent blood glucose control. This week’s episodes will extend what we see in the Statistics table to help us better understand Karen’s blood glucose control and how CGM data can be useful in doing so.