Introductions
- Who is leading this thing? Who is helping today?
- Who are you?
- Who are you?
- Why did you sign up for this workshop?
- Do you have any strong feelings about icebergs?
Learning Objectives
- Scatterplots
- Testing for correlation
- Linear Regression Modeling
- Import CSV Data
- Scatterplots, Histograms, & Other Plots/Graphs
- Logistic Regression Modeling
- In other words . . . some real analytical things.
- Please complete our Participant Survey
- We value your feedback!
Disclaimer
- This is NOT a statistics workshop
- This is a How-To in R workshop
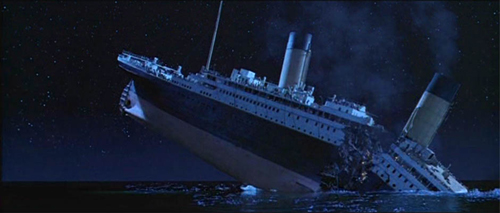
- They had five days to sink the Titanic
- We only have 3 hours for today's cruise . . . .
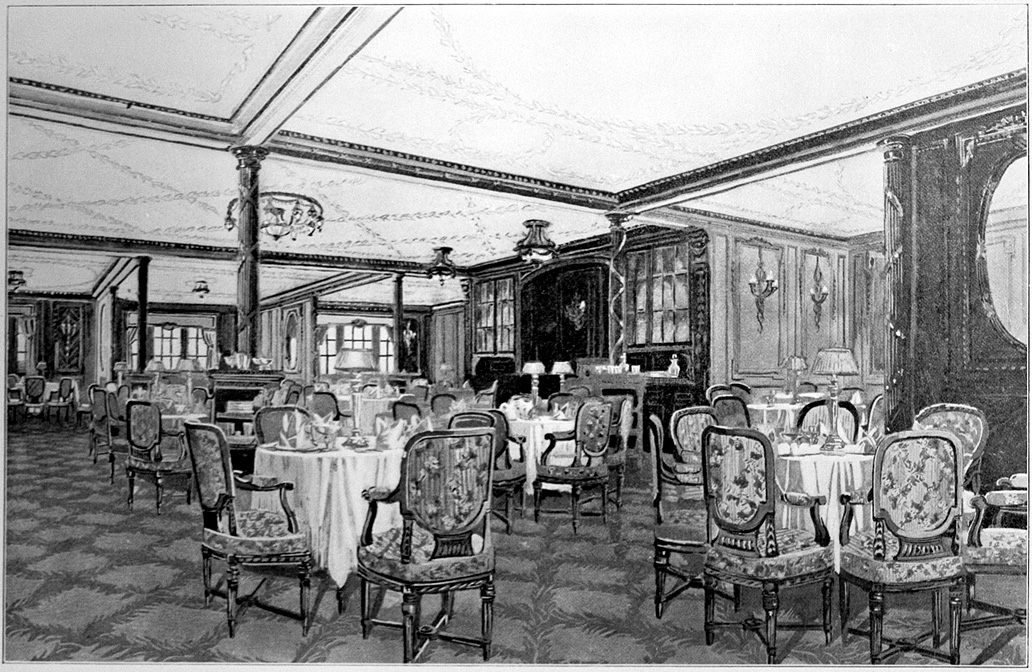
Fancy, yes. But is the service any good?
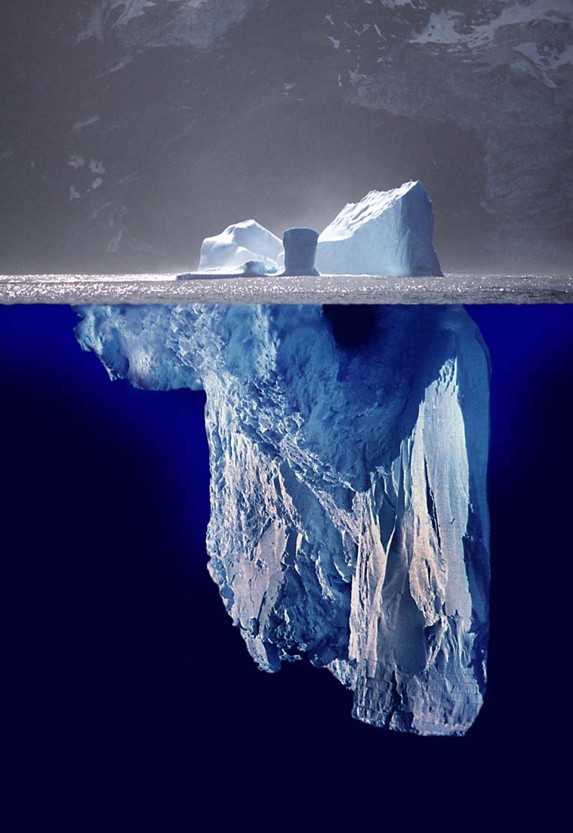
Just The Tip
Much to learn, you still have
--Yoda
Skipping lots of hard things
- User written functions
- Scope
- Local Project Structure
- Some of these are in the NEXT workshop!
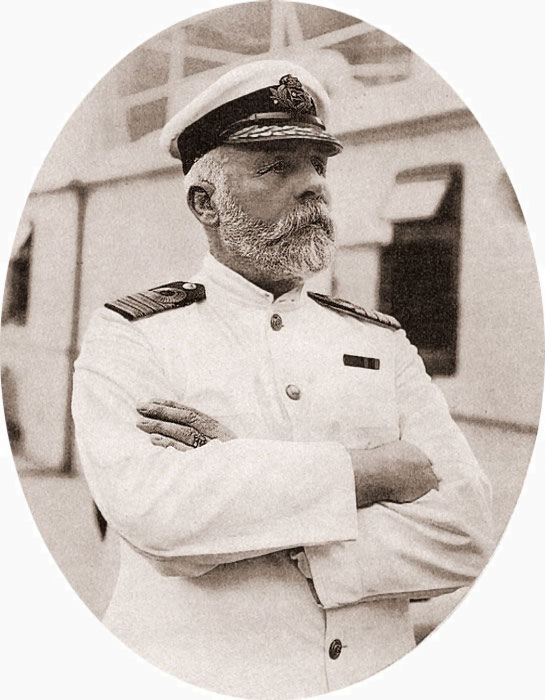
Captain Smith Says:
You must write code!
Do you want to see his code?
Maybe Not. He sank an "unsinkable" boat.
We will do this TOGETHER!
Stupid Questions?
- There are no stupid question!
- We are here to help you!
- Stop us if you feel you are getting lost
- Avoid any/all icebergs off the starboard bow
Brought to you by:

New York State Department of Health Epidemiology and Biostatistics Community of Practice (EBCoP)

Suny Albany, Rockefeller College of Public Affairs & Policy
- Two organizations NOT known for short names.
- Please complete our Participant Survey
- We value your feedback!
NEXT
Time For R
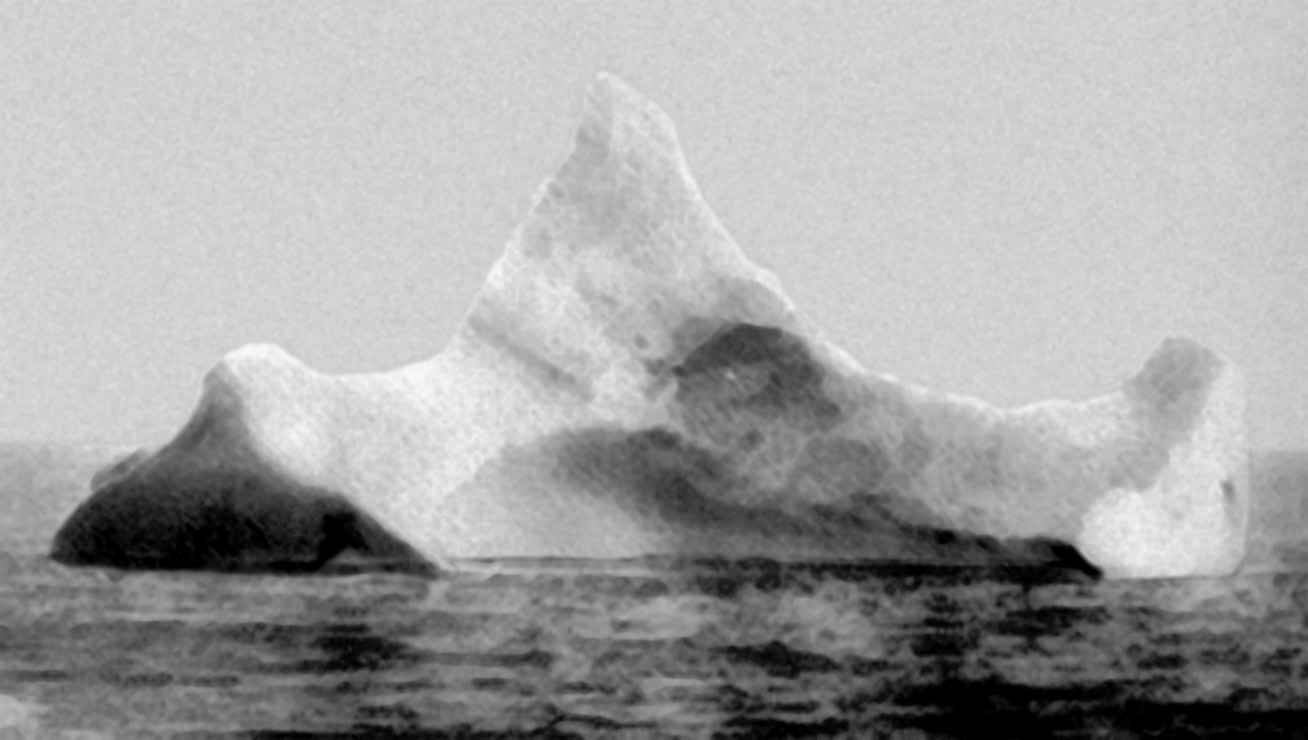
Photo of the iceberg believed to have sunk the RMS Titanic